Math Worth Thinking About: Making Math Matter to Students
Watch this video to see how placing mathematics in the context of important social issues can evoke emotional engagement from students.
Watch this video to see how placing mathematics in the context of important social issues can evoke emotional engagement from students.
The CT/Coding Advantage: Computational Modelling for Deeper Understanding
Watch this video to see how CT/Coding can enable students to create models to help them develop a stronger understanding of proportionality.
Minds On: Encountering Mathematical Discomfort
|
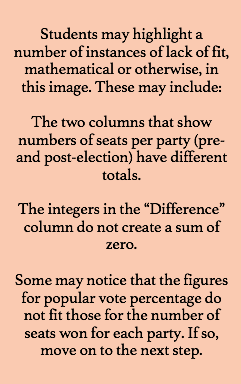
1. Present the image shown to the right to the class and briefly describe its context and content. Ask students to study it. Invite them to share any observations they find particularly important. If no such comments are forthcoming, ask them to look for things in the image that seem to lack a mathematical sense of fit.
|

https://www.theglobeandmail.com/canada/article-ontario-election-results-2018-a-map-of-the-live-results/
|
|
2. Ensure that the students’ attention is drawn to the fact that winning 40.5% of the popular vote allowed the Progressive Conservatives to form a majority government. Clarify political details as needed, then invite students to express their thoughts and opinions on this situation. During this discussion, define proportionality and ensure that students see that the number of seats won in this instance is not proportional to the corresponding vote percentage. 3. Explain that the tension between the number of seats won and the share of the popular vote attained by parties in Canada’s electoral system are central to this math learning experience on proportionality. |
|
|
Action: A Tale of Two Electoral Systems
4. Briefly instruct the students on the basics of the First Past the Post and Proportional Representation electoral systems. Provide students with the First Past the Post – Unplugged activity (shown below). Have them work on it in pairs. |
|
5. Debrief the activity with the students. Ensure that they recognize the proportionality in the Proportional Representation results and the lack of proportionality in the First Past the Post results. Discuss the question regarding system preference.
|
Action: Visualizing Election Results in Jupyter
6. It is now time for the students to work with authentic election data in a coding environment. Jupyter Notebook is a good tool for this purpose. It uses the Python programming language, but unlike other Python consoles, it allows for the importation of various libraries to enable the user to prepare data and represent it visually. There are several ways to download and install Jupyter Notebook, but the method found here is quite accessible to novice users. |
|
Two files are presented below. The one on the left is the First Past the Post Jupyter Notebook file for students. It leads students through the use of Jupyter Notebook to investigate proportionality in the context of the 2018 Ontario Election. Make it available to the students and have them work through it in pairs. The file on the right hand side is the teacher version of the same file. Much of it is identical to the student version. However, it does contain, for teachers’ reference, suggested approaches to the tasks that appear in the student file.
The Jupyter Notebook files contain several questions for students to consider as they work through the various tasks. These are wonderful opportunities for the teacher to conduct whole class discussions to help students consolidate their understanding of proportionality.
The Jupyter Notebook files contain several questions for students to consider as they work through the various tasks. These are wonderful opportunities for the teacher to conduct whole class discussions to help students consolidate their understanding of proportionality.
|
| ||||
7. Once students have completed the analysis of the provincial election data, assign them the task of analyzing the results of the most recent federal election in the same manner. To do this, they must research the results of the last federal election, create a dataframe for it as was done with the provincial election data, and create graphs for analysis. This task could be framed by the following question: “Are the results of the last federal election more or less proportional to the popular vote than the results of the recent provincial election? How do you know? What impacts could this have on Canadian society?”
Consolidating the Learning
8. The following questions can be used to help students consolidate their understanding of proportionality in the context of the Canadian electoral system:
8. The following questions can be used to help students consolidate their understanding of proportionality in the context of the Canadian electoral system:
- Do the results of the most recent federal election exhibit more or less proportionality than the results of the 2018 Ontario election? How do you know? How is this difference in proportionality shown on the graphs produced in Jupyter Notebook?
- What impacts would a move toward Proportional Representation have on Canadian society? Explain your reasoning.
- In what instances could Proportional Representation be seen as more fair than First Past the Post? In what instances could First Past the Post be seen as more fair than Proportional Representation?
- Which system do you prefer? Defend your choice with evidence (some of which must be math-based).
Extensions: Investigating Other Options
9. The First Past the Post electoral system is often criticized as being unfair because the winning party’s percentage of seats won is usually higher than its share of the popular vote. For example, in Ontario in 2018, the Progressive Conservatives won 61.3% of the seats despite earning 40.5% of all votes cast. This leads many to uphold Proportional Representation as the fair option. However, what if you were one of the successful PC candidates who was not allowed to assume the seat you won because it had to go to another party in order to make the seat numbers match the popular vote? Would you think that was fair? After all, you did outperform all the other candidates in your riding.
Neither system is perfect. Have students research other options. A good one to start with is Mixed-Member Proportional Representation. There are several different forms of this system, but they all attempt to blend FPTP and PR in some way. Have students learn about one manifestation of this system and code its results in Jupyter Notebook to analyze it for proportionality.
10. Students could also investigate the relationship between parties’ total numbers of votes and total numbers of seats won. In Ontario in 2018, the PCs received 2 324 742 votes and won 76 seats. That’s 30 588.71 votes per seat. On the other end of the spectrum, 264 094 Ontarians voted for the Green party, but all those votes resulted in only one seat. Students could investigate and discover the disproportionate relationship between votes earned and seats won, and make adjustments to reflect a proportional system.
Curriculum Expectations
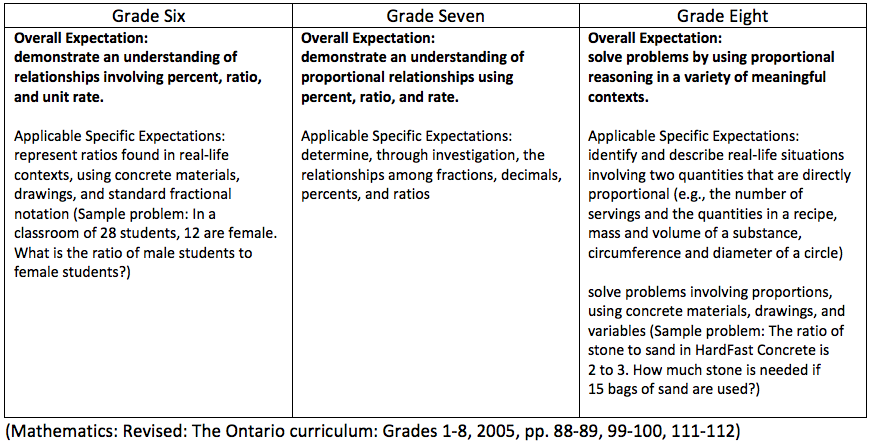
First Past the Post addresses the following curriculum expectations:
First Past the Post addresses the following curriculum expectations:
Acknowledgement
First Past the Post is partially based on the lesson “The Winner Takes It All…?” in Math That Matters by David Stocker (full citation below).
First Past the Post is partially based on the lesson “The Winner Takes It All…?” in Math That Matters by David Stocker (full citation below).
References
Big ideas and questioning - K to 12: Proportional reasoning. (2010). Retrieved June 25, 2018, from http://www.edugains.ca/resources/LearningMaterials/ContinuumConnection/BigIdeasQuestioning_ProportionalReasoning.pdf
[First past the post]. (n.d.). Retrieved June 28, 2018, from https://d3n8a8pro7vhmx.cloudfront.net/broadbent/pages/4935/attachments/original/1456927971/An_Electoral_System_for_All_Report.pdf?1456927971
Gadanidis, G., Brodie, I., Minniti, L., & Silver, B. (2017, April). Computer coding in the K-8 mathematics curriculum? Retrieved April 06, 2018, from http://www.edu.gov.on.ca/eng/literacynumeracy/inspire/research/computer_coding_k8_mathemathics_system.html
Kotsopoulos, D., Floyd, L., Khan, S., Namukasa, I. K., Somanath, S., Weber, J., & Yiu, C. (2017). A pedagogical framework for computational thinking. Digital Experiences in Mathematics Education,3(2), 154-171.
Mathematics: Revised: The Ontario curriculum: Grades 1-8. (2005). Toronto: Ontario Ministry of Education.
Ontario election results 2018: A map of the results. (2018, June 08). Retrieved from https://www.theglobeandmail.com/canada/article-ontario-election-results-2018-a-map-of-the-live-results/
Paying attention to proportional reasoning - Ontario. (2012). Retrieved from http://www.edu.gov.on.ca/eng/teachers/studentsuccess/ProportionReason.pdf
Stocker, D. (2008). Maththatmatters: A teacher resource linking math and social justice. Ottawa, Ont.: CCPA Education Project.