Math Worth Thinking About: Surprise and Patterns in a Probability Game
Watch this video to see:
Watch this video to see:
- how the element of surprise can be used to increase student engagement in mathematics, and
- how detecting patterns enables students to identify mathematical truths that would be difficult to model in real life.
The CT/Coding Advantage: Working with Larger Numbers of Combinations and Trials
Watch this video to see how the use of CT/Coding can help students:
Watch this video to see how the use of CT/Coding can help students:
- manage data efficiently in the face of increasing numbers of possible outcomes, and
- run large numbers of trials in a timely manner.
Minds On: Predicting a Fair Game
1. Present students with the following situation:
Even-Steven 2.0 is a two-player game in which both players are intended to have the same chance of winning. Three versions have been created. Which, if any, is/are fair? Here is how the game works:
1. Present students with the following situation:
Even-Steven 2.0 is a two-player game in which both players are intended to have the same chance of winning. Three versions have been created. Which, if any, is/are fair? Here is how the game works:

- Players take turns drawing two colour tiles from a paper bag. If the colours of the tiles are the same, Player 1 scores one point; otherwise, Player 2 scores one point. One game is comprised of 20 draws. The player with the most points is the winner.
- Predict which of the following versions is/are fair:
- Version 1: 1 red tile and 2 blue tiles
- Version 2: 2 red tiles and 2 blue tiles
- Version 3: 1 red tile and 3 blue tiles
2. Ask students, in pairs, to make and justify predictions about the fairness of each version. Then, invite pairs to share their predictions and reasons with the whole class.
|
Action: Finding Fairness and Extending to Three Colours
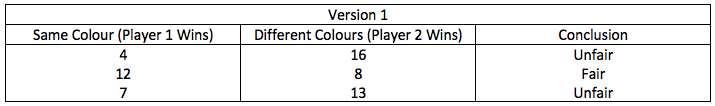
3. Invite students, still in pairs, to play one game of Even-Steven 2.0: Version 1. Remind them to keep track of the number of wins for each player. As they finish their games, ask them to reflect upon their results (as well as any other knowledge they might bring forward) to decide whether or not Version 1 is fair. 4. Once all pairs are done their games, compile the results into a chart like the one shown below. |
|
5. Repeat Steps 3 and 4 for Versions 2 and 3.
6. Facilitate a short class discussion. Ask students to consider the compiled data (as collected on the three charts) to either revise or confirm their predictions from Step 2. The original lesson from The Super Source – Probability/Statistics – Grade 7-8 provides the following questions to support student thinking and discussion:
7. Begin a discussion about theoretical probability and experimental probability. Elicit definitions of the two terms (e.g., theoretical probability - what should happen in theory as expressed by the comparison of the number of favourable outcomes to the total number of outcomes for an event; experimental probability – what actually does occur when an event is enacted as expressed by the comparison of the number of times an experiment yields a favourable outcome to the total number of trials in the experiment). Consider providing a simple example (e.g., flipping a coin, or drawing a single tile from the Version 1 bag in Even-Steven 2.0) to help students differentiate the two.
8. Ask students how they might determine the numbers of favourable outcomes and total outcomes they would need to determine the theoretical probability of either player winning Version 1 of Even-Steven 2.0. Depending on their background knowledge, they might use lists, matrices, or tree diagrams to find all outcomes. With this done, students can determine the number of favourable outcomes for each player and determine the theoretical probabilities of winning. If they compile complete lists of outcomes, they will find that Version 1 is not a fair game.
6. Facilitate a short class discussion. Ask students to consider the compiled data (as collected on the three charts) to either revise or confirm their predictions from Step 2. The original lesson from The Super Source – Probability/Statistics – Grade 7-8 provides the following questions to support student thinking and discussion:
- Did the sampling results match your predictions?
- How did you decide whether a version was a fair one? Explain any additional mathematical procedures you may have used.
- Does the compiled class data support the decision your pair made about the fairness of the version? Why or why not?
- Using the compiled class data, which versions, if any, are fair games?
- Are there any other methods, besides sampling, that can be used to evaluate the versions? Explain.
7. Begin a discussion about theoretical probability and experimental probability. Elicit definitions of the two terms (e.g., theoretical probability - what should happen in theory as expressed by the comparison of the number of favourable outcomes to the total number of outcomes for an event; experimental probability – what actually does occur when an event is enacted as expressed by the comparison of the number of times an experiment yields a favourable outcome to the total number of trials in the experiment). Consider providing a simple example (e.g., flipping a coin, or drawing a single tile from the Version 1 bag in Even-Steven 2.0) to help students differentiate the two.
8. Ask students how they might determine the numbers of favourable outcomes and total outcomes they would need to determine the theoretical probability of either player winning Version 1 of Even-Steven 2.0. Depending on their background knowledge, they might use lists, matrices, or tree diagrams to find all outcomes. With this done, students can determine the number of favourable outcomes for each player and determine the theoretical probabilities of winning. If they compile complete lists of outcomes, they will find that Version 1 is not a fair game.
|
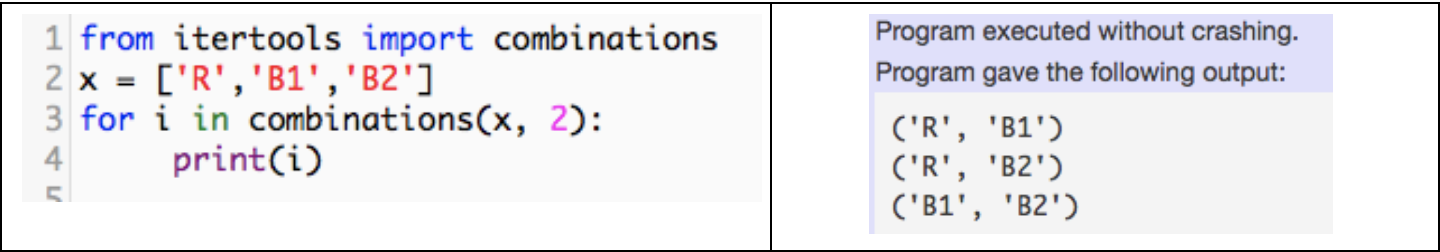
9. The Python code shown below produces all possible outcomes for Version 1. Present it to the students and ask them what they think it does. Have them enter and run the code at https://cscircles.cemc.uwaterloo.ca/console. It will produce the output shown.
|
|
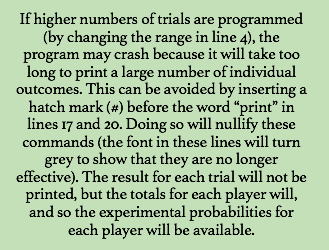
Some students may claim that not all outcomes are represented in the list. Ask them to replace the word “combinations” with “permutations” (in both locations), and then run the adapted code. Have students use the results from both versions of the code to determine the theoretical probabilities of winning for each player (# favourable outcomes/total # outcomes). Discuss the differences and similarities between the uses of “combinations” and “permutations” for this purpose, as well as how the theoretical probabilities compare with the experimental results compiled for Version 1 in Step 4. Also, discuss the advantages and disadvantages of using Python to determine outcomes as opposed to doing so by hand as done in Step 8.
|
10. The Scratch code linked here (https://scratch.mit.edu/projects/225801388/#editor) determines the experimental probability for Version 1 of Even-Steven 2.0 . Model its use with a low number of trials by inserting a small number (e.g., 20) in the large loop and clicking the green flag. Do this several times. In this context, results will probably vary as much as they did in the unplugged version of the game in Steps 3 and 4. Ask students what they would expect to happen if the number of trials were increased. Model this in Scratch by running the code with higher numbers of trials (e.g., 100, 1000). The results should be more consistent and in line with theoretical probability. Use this as an opportunity to address the idea that experimental probability tends to approach theoretical probability as the number of trials increases.
|
|
11. The Python code shown below also determines the experimental probability of Version 1. Enter and run the code at https://cscircles.cemc.uwaterloo.ca/console. Show how it also can yield varying results with low numbers of trials, but that the results become more consistent (and closer to theoretical probability) when higher numbers of trials are used. Discuss preferences between the two coding environments.

|
|

12. At this point, students know that Version 1 is not fair. Have them tinker with the codes given in Steps 9 – 11 to produce experimental and theoretical probabilities for Versions 2 and 3 of Even-Steven. Sample codes for teacher reference are provided below.
Version 2: 2 red tiles, 2 blue tiles:
Scratch - https://scratch.mit.edu/projects/228419645/#editor
Python -
Version 2: 2 red tiles, 2 blue tiles:
Scratch - https://scratch.mit.edu/projects/228419645/#editor
Python -

Experimental
|

Theoretical

|
Version 3: 1 red tile, 3 blue tiles:
Scratch (Experimental) - https://scratch.mit.edu/projects/228383805/#editor
Python -
Scratch (Experimental) - https://scratch.mit.edu/projects/228383805/#editor
Python -

Experimental
|

Theoretical
|
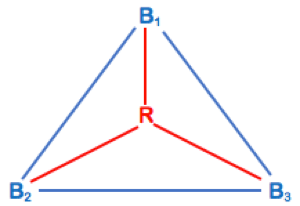
13. After remixing the codes described in Step 12, students will see that Version 3 is the only one that provides a fair game. Most students find it counter-intuitive that it is fair while Version 2 (with equal numbers of red and blue tiles) is not. Discuss why the 1:3 ratio works. By linking the red tile to three blue tiles, equal numbers of same-colour and different-colour pairs are created as shown in the image below. Students will need to understand this effect and use it in Step 14.
|

|
14. Challenge students to develop a fair version of Even-Steven 2.0 using three colours of tiles. The increased rigour of this challenge will likely cause some students to fall back onto the false assumption that equal numbers of tiles of each colour will yield a fair game. Explicitly tell them that the fact that the 2:2 ratio in Version 2 did not work indicates that similar 3 colour combinations are unlikely to give them the desired result. Advise them to use the logic described in Step 13 as their starting point for making predictions for a fair three-colour game. Direct them to test their predictions by adapting one or more of the codes presented in Steps 9 to 11. A correct response will extend the 1:3 ratio to 1:3:9. Just as connecting three blue tiles to the lone red tile made a fair game with two colours, connecting three yellow tiles to each blue tile will maintain the fairness. This means that 9 yellow tiles, in addition to the 1 red and 3 blue, will create a fair game.
Here is another way to think about it. 1 red and 3 blue already create a fair game, so these four can be thought of in terms of being non-yellow. Each non-yellow tile connects separately to each of the 9 yellow tiles, thus forming 36 new different-colour pairs. Y1 connects to each of the eight other yellow tiles, thus forming eight new same-colour pairs. Y1 is no longer available to make new pairs. When Y2 is connected to the other yellow tiles, there is one less tile available (because its connection with Y1 has already been made), so seven new same-colour pairs are formed. The number of new same-colour pairs decreases by one each time a new yellow tile is drawn first, thus producing the following:
Here is another way to think about it. 1 red and 3 blue already create a fair game, so these four can be thought of in terms of being non-yellow. Each non-yellow tile connects separately to each of the 9 yellow tiles, thus forming 36 new different-colour pairs. Y1 connects to each of the eight other yellow tiles, thus forming eight new same-colour pairs. Y1 is no longer available to make new pairs. When Y2 is connected to the other yellow tiles, there is one less tile available (because its connection with Y1 has already been made), so seven new same-colour pairs are formed. The number of new same-colour pairs decreases by one each time a new yellow tile is drawn first, thus producing the following:


Simple addition shows that the number of new same-colour pairs is 36. Interestingly, the numbers in the table easily create 4 groups of 9 (1 + 8 = 9, 2 + 7 = 9, 3 + 6 = 9, 4 + 5 = 9), thus mimicking the manner in which different-colour pairs are created with the same new tiles. Given that 36 different-colour pairs are also formed with the addition of 9 yellow tiles, and the two colour 1:3 version was already fair, the 1:3:9 ratio must create a three-colour fair version of Even-Steven 2.0. Students can test this solution by remixing the Python code shown in Step 9 and using the results to find the theoretical probability.
Consolidating the Learning
15. The original lesson from The Super Source – Probability/Statistics – Grade 7-8 provides the following questions to support student thinking and discussion about the three-colour version of Even-Steven:
Extension: Applications to Dependent Events
16. Have students return to the original three versions and consider how they might be different if one tile was drawn first, recorded, then returned to the bag to be available for the second draw. This change makes the events independent. Ask them to predict whether the probabilities (both theoretical and experimental) would change and why. Have them remix the codes to represent independent events to determine which, if any, versions are fair. Then, on the basis of the fair version (there is one) have them create and code a three-colour version.
Consolidating the Learning
15. The original lesson from The Super Source – Probability/Statistics – Grade 7-8 provides the following questions to support student thinking and discussion about the three-colour version of Even-Steven:
- How did you decide how many of each colour to put in the bag at first? Did you use any mathematical procedures or strategies to help you decide?
- If you concluded that your first version was not a fair game, how did you decide what changes to make?
- How do you know that your final version is a fair one? Explain.
- What would you expect to happen if a fair version were played ten times?
Extension: Applications to Dependent Events
16. Have students return to the original three versions and consider how they might be different if one tile was drawn first, recorded, then returned to the bag to be available for the second draw. This change makes the events independent. Ask them to predict whether the probabilities (both theoretical and experimental) would change and why. Have them remix the codes to represent independent events to determine which, if any, versions are fair. Then, on the basis of the fair version (there is one) have them create and code a three-colour version.
Curriculum Expectations
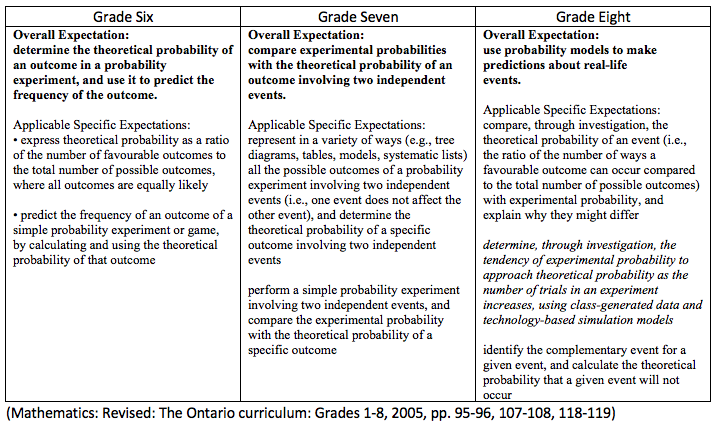
Even-Steven 2.0 - Coding a Fair Game addresses the following curriculum expectations:
Even-Steven 2.0 - Coding a Fair Game addresses the following curriculum expectations:
Acknowledgement
Even-Steven 2.0 - Coding a Fair Game is based upon "Even-Steven" from The Super Source: Probability/Statistics - Grades 7-8. The original lesson can be found here.
References
Buteau, C., Gadanidis, G., Lovric, M., & Muller, E. (2017). Computational thinking and mathematics curriculum. In S. Oesterle, D. Allan, & J. Holm (Eds.), Proceedings of the Canadian Mathematics Education Study Group (CMESG) 2017, Kingston (119-135). Kingston: CMESG.
Gadanidis, G., Borba, M., Hughes, J. & Lacerda, H. (2016). Designing aesthetic experiences for young mathematician: A model for mathematics education reform. International Journal of Mathematics Education Research 6(2), 225-244.
Gadanidis, G., Brodie, I., Minniti, L., & Silver, B. (2017, April). Computer coding in the K-8 mathematics curriculum? Retrieved April 06, 2018, from http://www.edu.gov.on.ca/eng/literacynumeracy/inspire/research/computer_coding_k8_mathemathics_system.html
Gadanidis, G., Cendros, R., Floyd, L., & Namukasa, I. (2017). Computational thinking in mathematics teacher education. Contemporary Issues in Technology and Teacher Education, 17(4), 458-477.
Gadanidis, G., Clements, E., & Yiu, C. (2018). Group theory, computational thinking, and young mathematicians. Mathematical Thinking and Learning: An International Journal, 20(1), 32-53.
Kotsopoulos, D., Floyd, L., Khan, S., Namukasa, I. K., Somanath, S., Weber, J., & Yiu, C. (2017). A Pedagogical Framework for Computational Thinking. Digital Experiences in Mathematics Education,3(2), 154-171.
Paquin, A. (2017, April). What is CT? Retrieved June 12, 2018, from http://mathlearningjourney.weebly.com/what-is-ct.html
Mathematics: Revised: The Ontario curriculum: Grades 1-8. (2005). Toronto: Ontario Ministry of Education.
The super source: Probability/statistics - Grades 7-8. (2007). Vernon Hils, IL: ETA/Cuisenaire.